MyReport Charts in your report
Useful guidelines to include charts in your report, when there is available data for it.
Challenge:
include charts in the report, when it makes sense to the data.
Solution
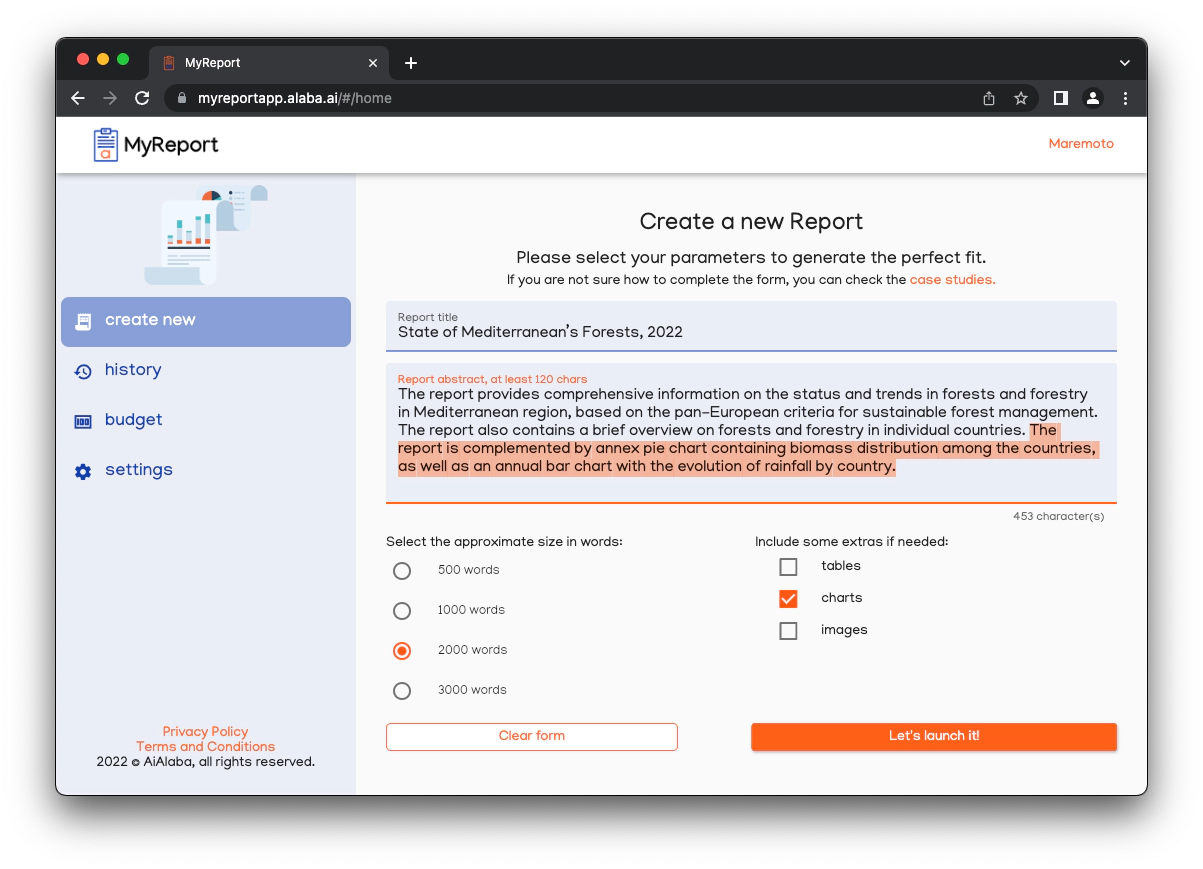
If you need to include some extra features to the report, as charts, you will not only need to activate the charts checkbox but it is highly recommendable to include some indication in the abstract as well.
The results will improve if the type of chart is also included in the description.